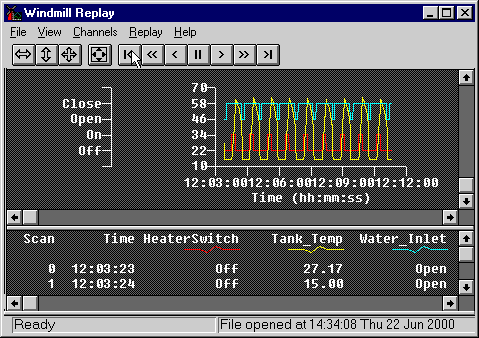
Windmill Replay plays back logged data files graphically. It's ideal for scrolling through long files looking for significant events. You can fast forward through uneventful stretches, and pause for a more detailed look when something catches your eye.
Moving Graph and Table of Values
The Replay screen is split between the moving graph and a table of data values. How much space is devoted to each is up to you. When the graph is static, double-clicking a point on it will highlight the relevant row in the table. Similarly you can double-click a point on the table and the cursor will show the corresponding points on the graph.
Unlimited Zooming
You can zoom in and out of the graph as many times as you wish, choosing whichever area you please. Show data over a longer time-scale, or data from more channels.

Features
You can choose:
- Which channels to display: four channels of data from one instrument and four from another for example
- The colour of each channel's trace on the graph
- How many decimal places should be shown in the readings
- The split between graph and table
- The area to print
- Zoom area and magnification
- Direction of replay: forward or reverse
- Speed of replay: slow or fast
Replay is an add-on to the Windmill suite, which offers logging, charting, hardware set-up, netDDE and process mimics. Other add-ons are available. Windmill runs under Microsoft Windows.
